
Stop overpaying for power. Start managing it.
EnergyCloud is software that reads your electricity bills. It checks them for mistakes, tests whether you are on the right tariff, and tracks what you save. You get your energy costs in Rands, not in graphs of kilowatt-hours.
Meters show usage. We show overspend.
This is for any business that does not fully trust its electricity bill, from one shop to a whole property portfolio. Built for South Africa first: Eskom and municipal tariffs, time-of-use rates, demand charges and load-shedding.
- Pretty graphs of kilowatt-hours
- Tells you what happened, after month-end
- No view on whether the bill is even correct
- Leaves tariff, demand and errors for someone else
- Reads the actual bill and audits it for errors
- Models cheaper, legitimate tariffs — and proves the saving
- Flags cost spikes within days, not at month-end
- Tracks identified vs. captured savings to budget
Upload. Analyse. Act. Track.
No spreadsheets and no consultants. Start with one bill, then grow into watching costs across every site you run.
Drop in a bill — PDF or a phone photo — or connect meter data. No hardware, no on-site visit.
AI breaks down every charge, checks tariff fit, flags errors and quantifies the saving — in about 30 seconds.
Work a prioritised, plain-English list — switch tariff, right-size demand, dispute an overcharge.
Savings tracked to budget, anomalies alerted, board-ready report out every month — automatically.
Send one bill. See your savings.
The software reads your bill, works out which tariff you are on and shows where the money goes. Then it grades your site. Free, and nobody phones you unless you ask.
- Free — no follow-up unless you ask.
- POPIA-compliant — your bill is analysed here in South Africa, and our privacy notice says exactly where everything else goes.
- Megaflex, NightSave, Miniflex, municipal — PDF, JPG or CSV.
- You keep the report. If we're not the right fit, take it to whoever is.
Built around money. Not meters.
Everything is built around cost, savings and budgets. Anything still on the roadmap is labelled as such, not dressed up as live.
Financial intelligence
The core- AI bill analysisInstant breakdown of every charge — understand exactly what you pay for.
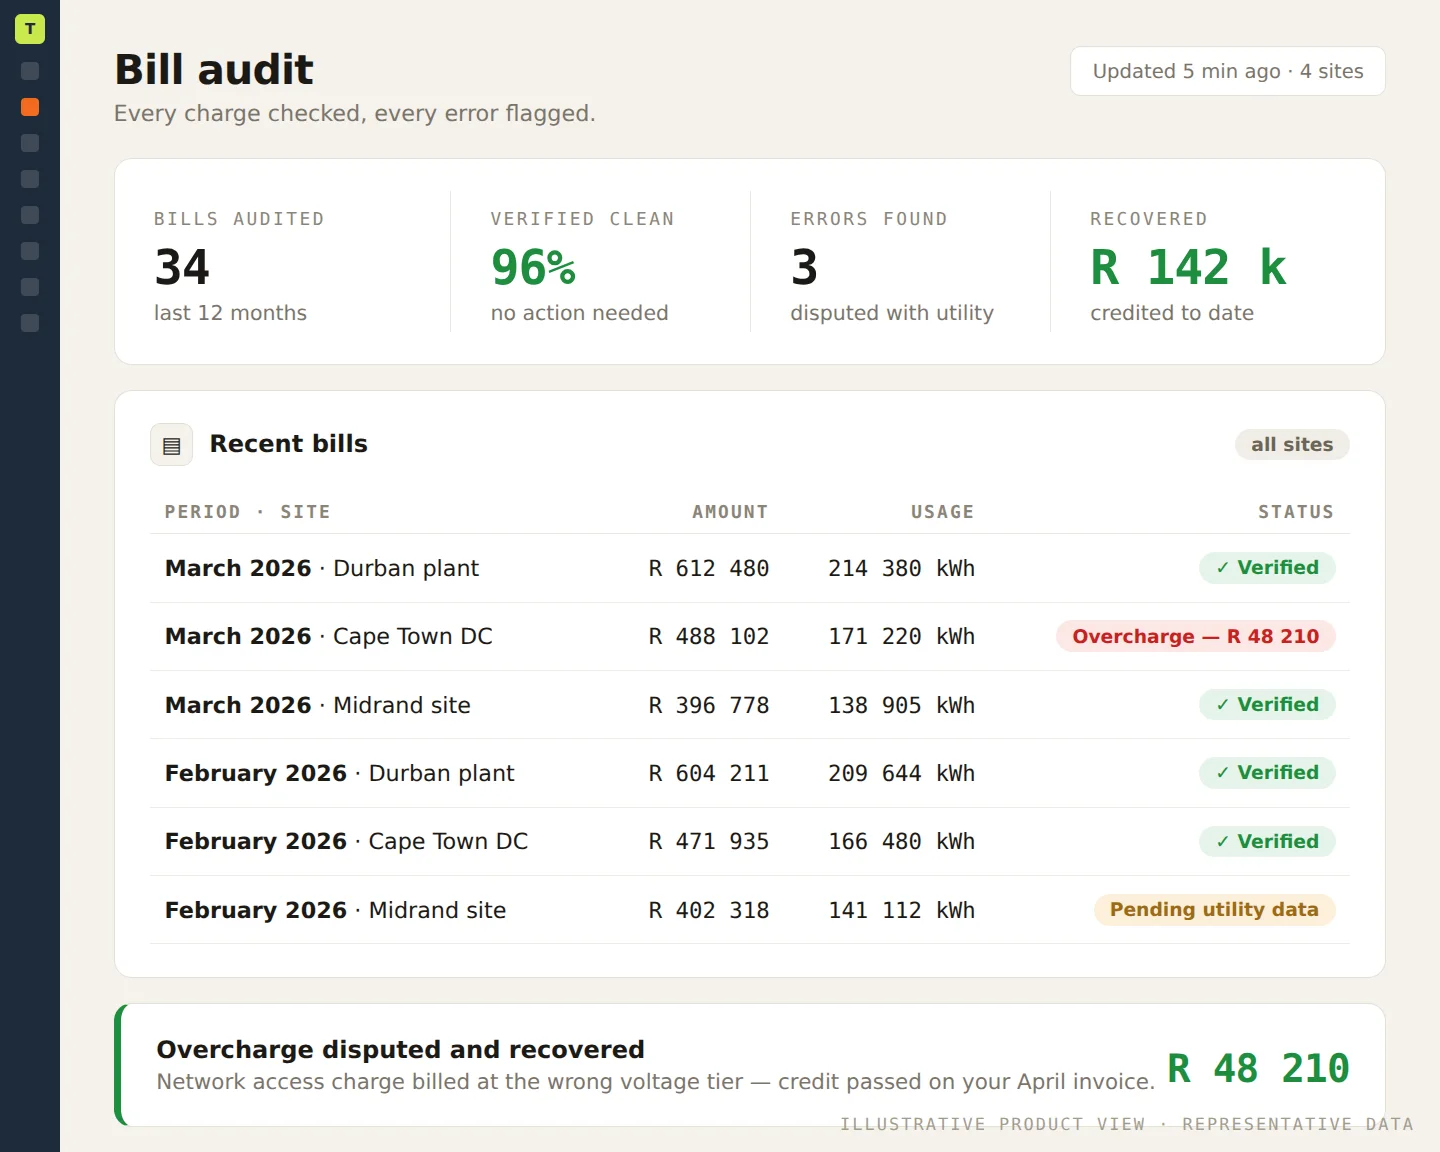
- Bill auditCharges checked against the correct tariff schedule — catches overcharges you'd never spot.
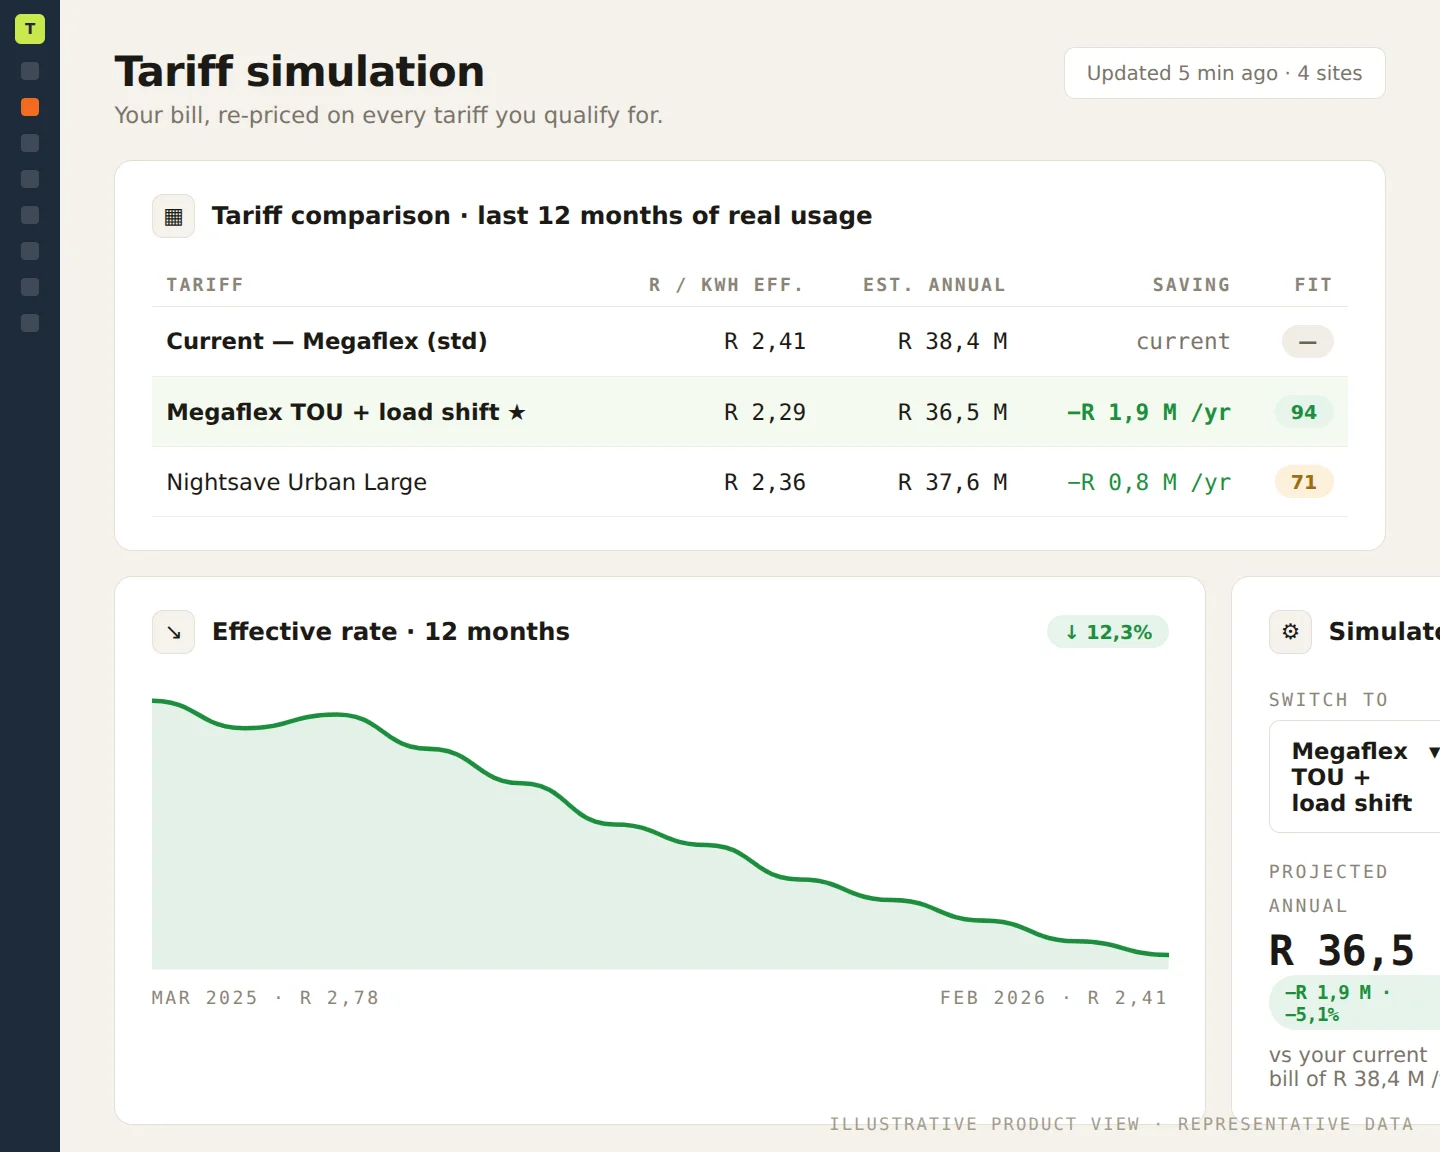
- Tariff optimisation & simulationModels your usage on alternative tariffs — switch to the cheapest legitimate one, proven first.
- Peak-demand analysisUtilisation and excess-demand modelling — avoid penalties, right-size your notified maximum demand.
- Time-of-Use optimisationPeak→off-peak shift modelling — cut cost by moving load, not cutting output.
- Dispute generationAI-drafted dispute letters for billing errors — recover money without the admin.
- Budgets, forecasts & savings trackingTargets, projected spend, identified vs. captured savings YTD — proof of ROI, not promises.
Monitoring & alerts
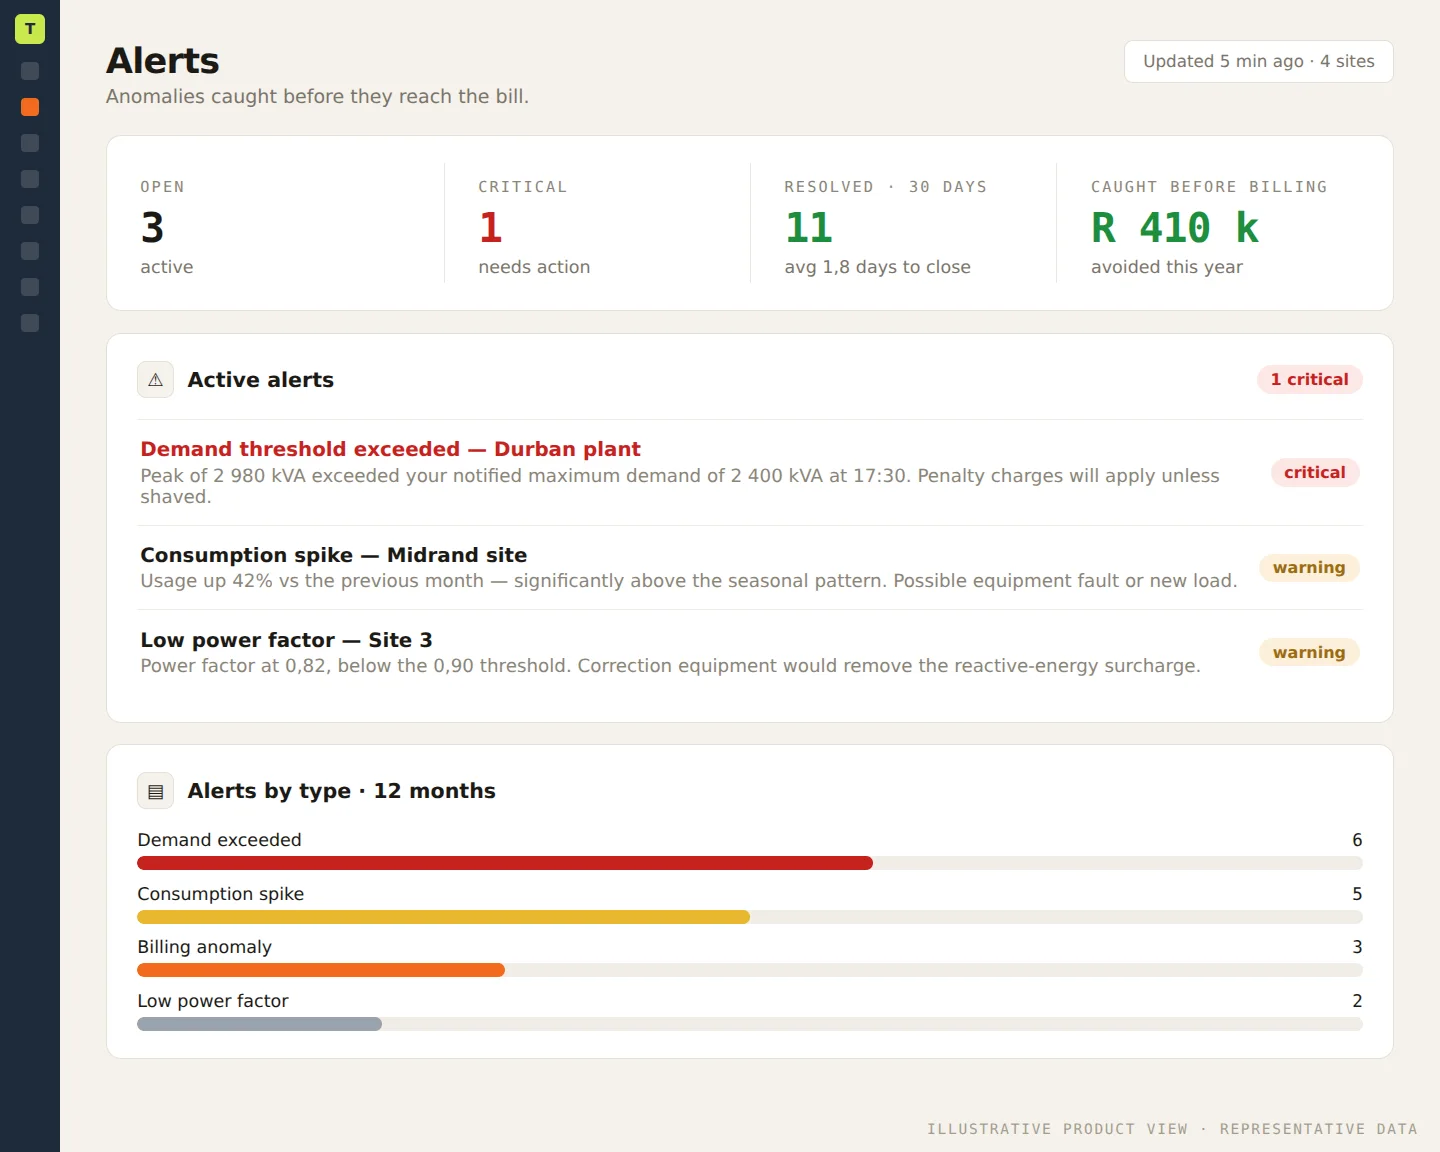
Catch it early- Automatic anomaly detectionCost, consumption, demand spikes and billing gaps — known within days, not at month-end.
- Configurable alertsThresholds and rules per site / meter — the right person hears about the right problem.
- Energy monitoring (EMS)Live smart-meter dashboards and edge control for real-time visibility.Roadmap
Reporting & portfolio
Board-ready- 360° Energy ScorecardA single graded score across cost, efficiency, demand and data quality.
- Scheduled & exportable reportsAutomated monthly digests, PDF / Excel export — stakeholder reporting on autopilot.
- Multi-site portfolio rollupCompare and rank every property / meter — find worst performers and quick wins.
- Scope 2 carbon trackingMarket-specific emission factors — ESG and compliance without a separate tool.
One platform. Any size business.
A single shop and a national property portfolio have different problems. The loop that fixes them is the same: find it, fix it, prove it.
Single site
One shop or office. No energy expertise on staff.
"My bill is confusing and I think I'm overpaying."
Upload a bill — instant breakdown, error audit and a cheaper-tariff recommendation.
"A random spike wrecked my month."
Automatic spike alerts within days, not at month-end.
"I have no time for this."
No consultants, no spreadsheets — analysis in minutes.
Several sites
Multiple meters and real demand charges.
"Demand penalties keep biting me."
We check your peak demand and flag what you are over-paying for before it's charged.
"Am I even on the right tariff?"
Tariff simulation proves the cheaper option before you switch.
"I can't see across my sites."
Portfolio view ranks every meter; budgets keep each site on target.
Portfolio & board
Multi-property, with board and ESG reporting.
"Reporting to the board eats days."
360° Scorecard + scheduled PDF / Excel reports, automatically.
"We need Scope 2 carbon numbers."
Built-in emissions tracking with market factors.
"Energy data lives in 30 places."
One multi-tenant platform; roadmap for tenant billing, solar, batteries and wheeling.
We audit the bill — not just the meter.
This is a worked example of a typical job, not a real customer.* It shows what a bill audit finds and what it is worth. Real per-site figures are shared under NDA.
Financial-first
Built around cost, savings and budgets — not meters.
SA-native
Eskom and municipal bills, Megaflex and time-of-use rates, peak-demand penalties.
Audits the bill
Catches overcharges other tools never look for.
Captured savings
Tracks identified vs. captured — proof, not promises.
Freemium on-ramp
Free report first. Low risk to start.
Move three sliders. Get a rough number.
Tell us what you spend, how many sites you run and how exposed you are. You get a ballpark, not a quote. The real number comes off your bill.
Indicative only. Typical engagements identify 6–14% of annual spend across tariff fit, right-sizing your demand, moving work to cheaper hours and recovering billing errors.
Start free. Pay when it works.
Low risk to start. Prove the saving on one bill, then grow into full monitoring across your sites. Same platform the whole way.
Bill Analyser
A free, instant AI analysis of your tariff exposure. Upload one bill and EnergyCloud tells you, in plain Rands, where your money is going.
- One invoice in, full report out
- ~30-second AI turnaround
- 360° Scorecard preview
- No commitment, no follow-up
EnergyCloud Professional
A monthly subscription. Continuous monitoring, bill audit and tariff optimisation for a site — with alerting the moment something moves.
- Continuous bill & consumption monitoring
- Tariff advice and peak-demand guidance
- Anomaly & tariff-change alerting
- Budgets, savings tracking & monthly reports
EnergyCloud Enterprise
Portfolio-wide cost management for multi-property operators. Rollup across every meter, Scope 2 carbon, API access and role-based access for finance, facilities and ops.
- Multi-site, multi-meter portfolio rollup
- 360° Scorecard & scheduled board reports
- Scope 2 carbon tracking
- API access & role-based permissions
Your bills, audited by AI. Your savings, tracked to the rand.
The quickest way in is to send a recent invoice. You get your analysis on screen in about 30 seconds — what you are overpaying, and what to do about it.